We’ve all seen the high-flying offenses of the PAC-12, teams like Washington State and USC that have no problem averaging 400+ yards and 30+ points per game.
But, how good are they really? How much “grit” did they have when critical situations were on the line? It’s one thing to gloat over an opulence of yardage, but if you can’t convert on critical downs or make it from the red zone into the end zone, then your opulence might be more conundrum than competence.
It reminds me of the man who looked to the heavens and asked, “God, what’s it like to live in time that never ends?”
God replied, “Well, it’s like a million years is no more than a second to me.”
The man then asked, “And, what’s it like to own everything in the universe?”
God replied, “Well, it’s like a million bucks is no more than a penny to me.”
The man thought for a moment, then asked, “In that case, can I have a million bucks?”
God said, “Sure. Hold on a second.”
For this exercise, I experimented with various analytical methods and concluded that the best way to compare the “glitz” with the “grit” of each team was to rank each one in terms of its yards per game, then average that with their ability to convert critical downs—third down, fourth down and red zones. Although it’s a simplistic approach, it should help us separate gloaters from the gladiators.
Without looking at our full chart below, can you guess which team had the best composite ranking for converting critical downs?
I admit, I was surprised to find it is Arizona. I suppose I should have considered Arizona since our preview of the PAC-12 pointed to a very good 2020 season for the Wildcats. Key metrics in our system are very high for UA despite losing records the past two seasons.
Oregon, Utah, Washington State and UCLA were the only teams to rank worse in converting critical downs than they were in producing yardage. It will be interesting to see how Oregon and Washington State do in 2020 since the Ducks have a dynamic new offensive coordinator and the Cougars have overhauled their coaching staff.
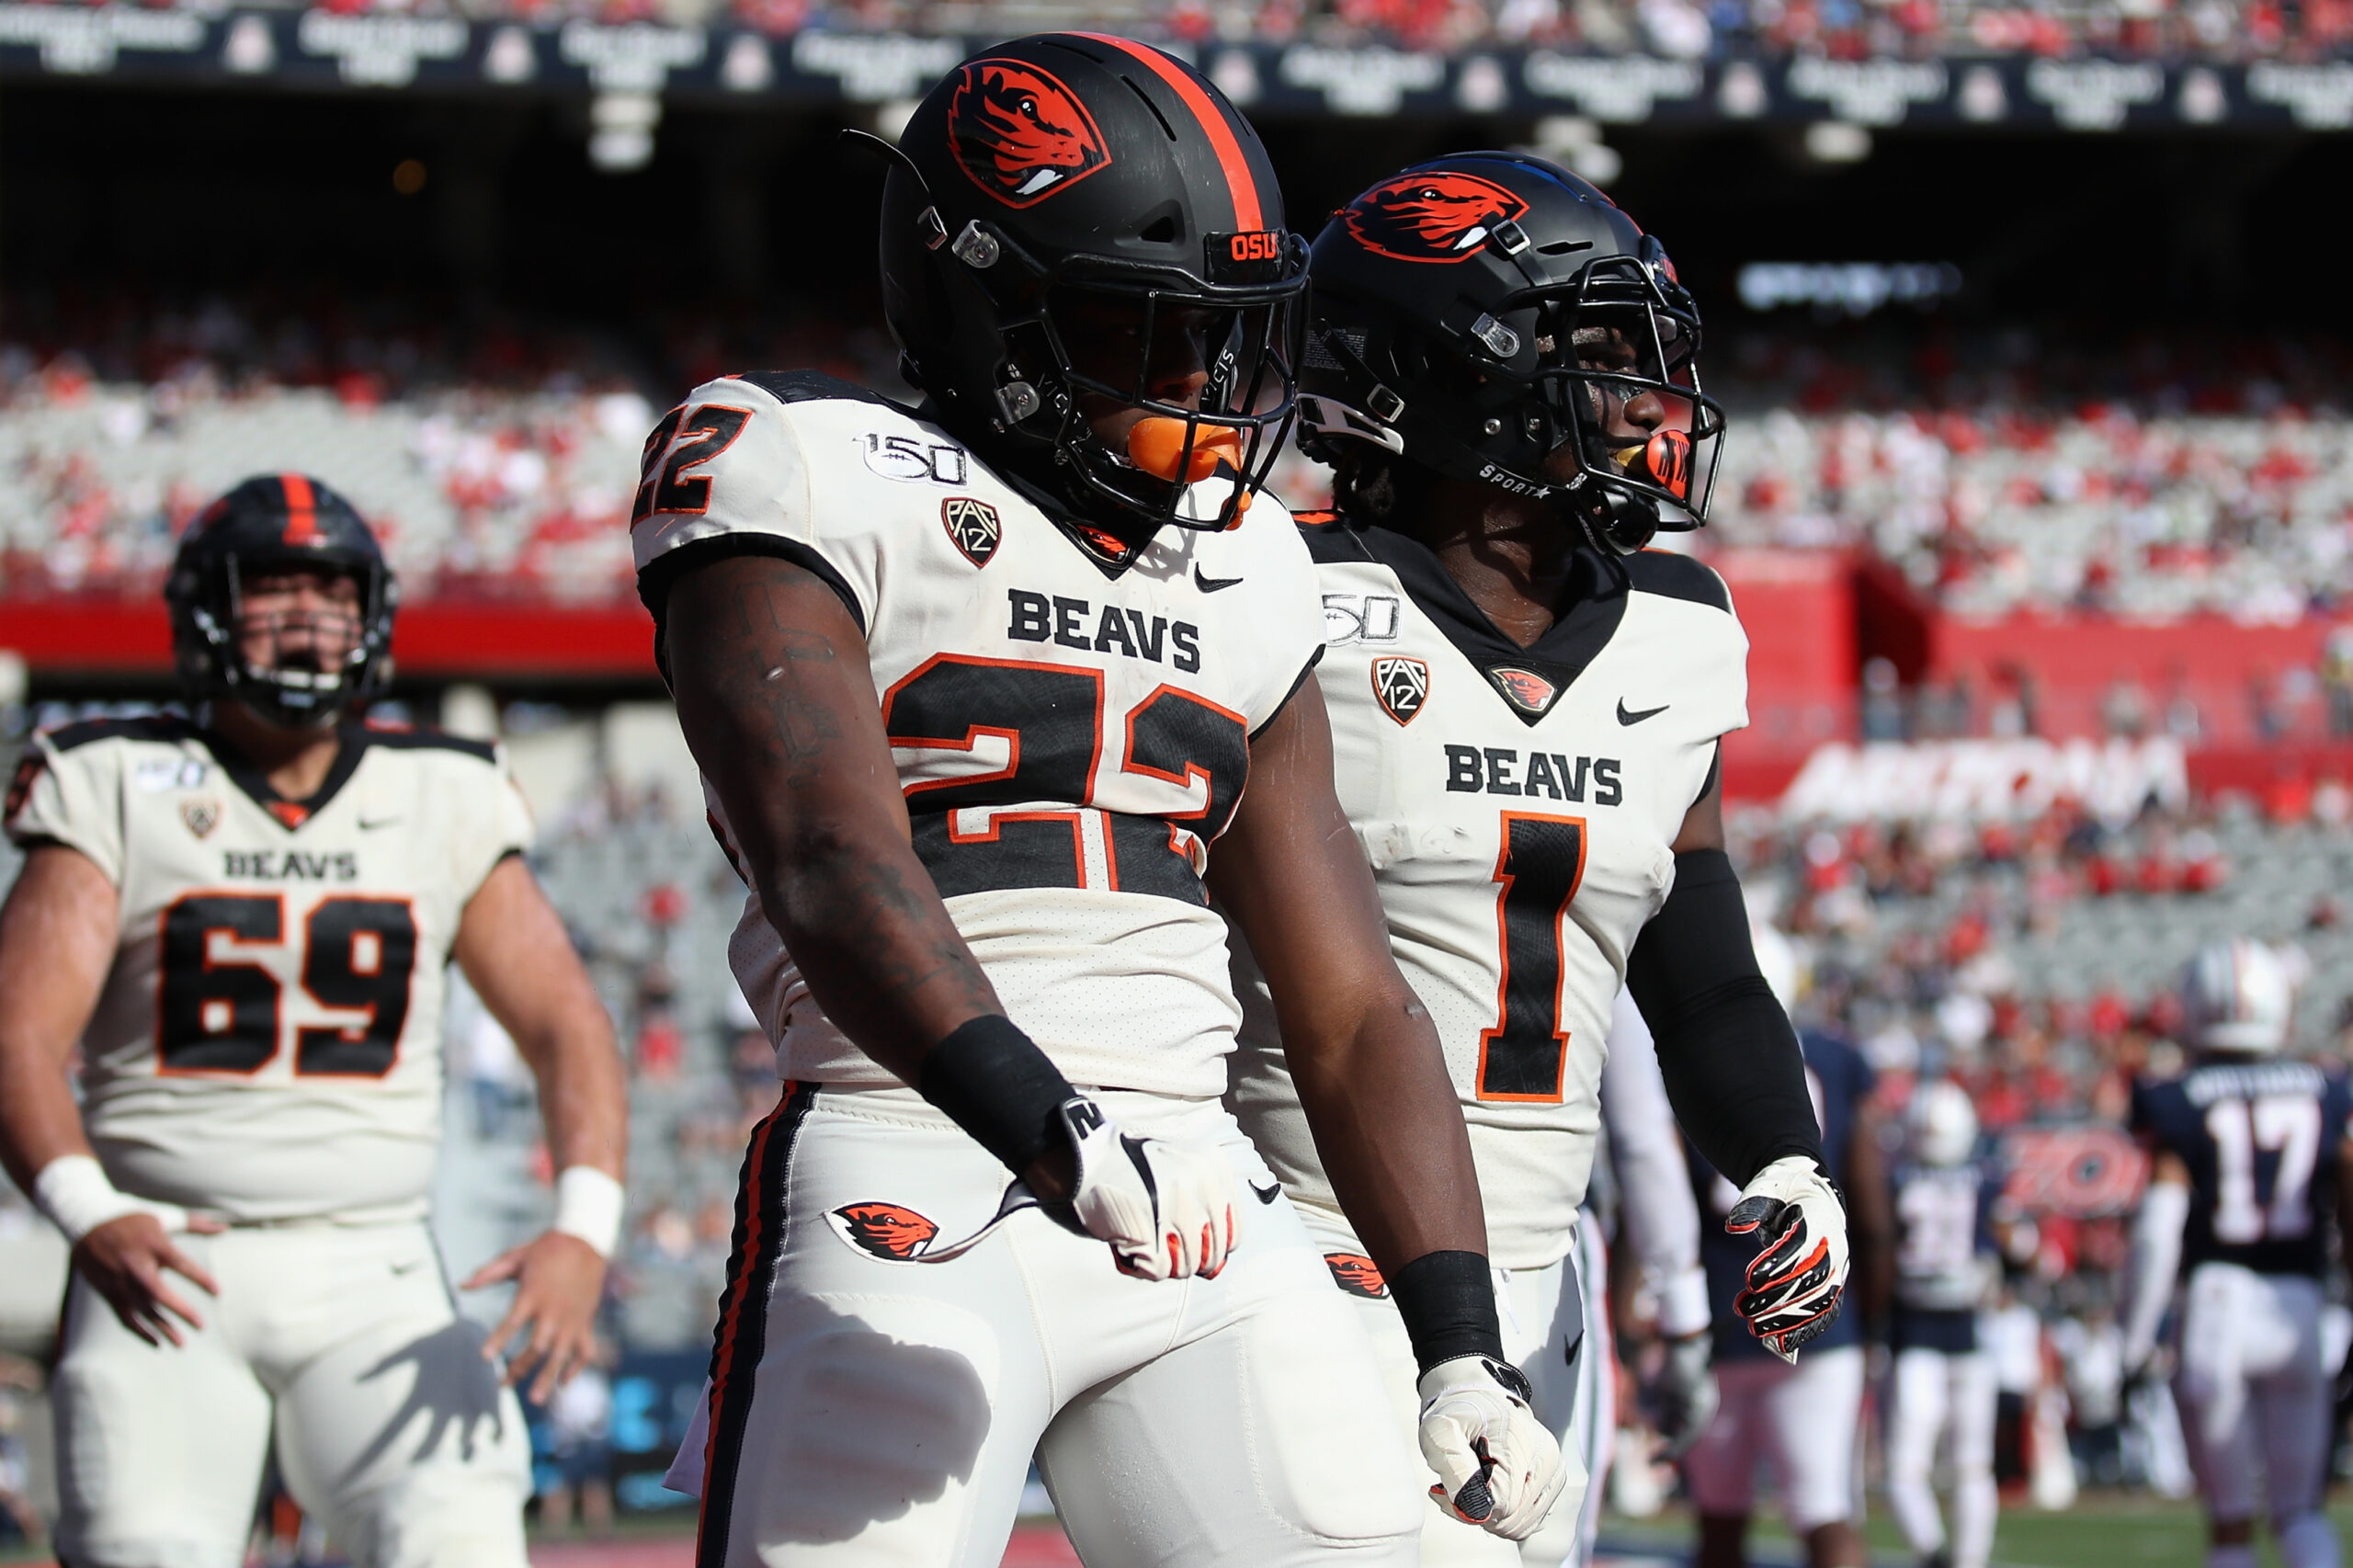
It could be said that Oregon State had the most offensive grit since the Beavers finished in the bottom half of the PAC-12 for producing yardage but second in converting critical downs which means the Beavers overcame their modest ability to move the ball by making the definitive plays when it mattered most.
California was the opposite. The Bears not only couldn’t move the ball, but couldn’t make the definitive plays. The Bears finished dead last in both.
| net rank | yardage per game PAC-12 rank | critical conversions [3rd-4th–red zone] PAC12 rank | average | 3rd down natl rank | 4th down natl rank | red zone natl rank | |
| 1 | Washington St. | 1 | 4 | 2.5 | 43 | 91 | 99 |
| 2 | Arizona | 5 | 1 | 3.0 | 28 | 19 | 53 |
| 3 | USC | 4 | 3 | 3.5 | 17 | 94 | 57 |
| 4 | Oregon St. | 7 | 2 | 4.5 | 39 | 38 | 52 |
| 5 | Washington | 6 | 4 | 5.0 | 21 | 33 | 66 |
| 6 | Utah | 3 | 7 | 5.0 | 72 | 126 | 37 |
| 7 | Oregon | 2 | 9 | 5.5 | 93 | 115 | 53 |
| 8 | Arizona St. | 8 | 6 | 7.0 | 42 | 61 | 11 |
| 9 | Colorado | 10 | 8 | 9.0 | 102 | 8 | 19 |
| 10 | UCLA | 9 | 10 | 9.5 | 48 | 33 | 89 |
| 11 | Stanford | 11 | 10 | 10.5 | 44 | 73 | 96 |
| 12 | California | 12 | 12 | 12.0 | 83 | 55 | 16 |


